- Overview
Limnologists (scientists that study lakes and reservoirs) are interested in obtaining detailed data of several water quality parameters. Many of these parameters can be measured remotely, that is, without having to bring samples to a laboratory for analysis. The following pages will describe some of the parameters that can be measured remotely, and explain how limnologists, as well as non-limnologists, might use these data to better their understanding of Central New York State’s lakes and tributaries in general.
- Temperature
What is it?
Temperature [T, units of degrees Celsius (°C)] is a measure of molecular vibrational energy.
How is it measured?
Many different methods can be used to measure temperature. Commonly liquid-in-glass thermometers are used to determine temperature. Though this method can be very reliable and accurate, a thermometer is not as useful when making measurements where the thermometer is not easily viewed (such as below the water surface). Methods that are more applicable include thermocouples and thermistors. The thermocouple measures the current generated by two dissimilar (different) metals at different temperatures. The buoy’s probe package utilizes a thermistor. A thermistor consists of a ceramic-like semiconducting material which has the property of decreasing resistance with increasing temperature. By measuring the voltage change across the thermistor, the temperature of the surrounding water may be obtained
Why is it important?
The temperature of water has extremely important ecological consequences. Temperature exerts a major influence on aquatic organisms with respect to selection/occurrence and level of activity of the organisms. In general, increasing water temperature results in greater biological activity and more rapid growth. All aquatic organisms have a preferred temperature in which they can survive and reproduce optimally. For example, trout typically need cold water which may not be available in shallow waters during the summer.
Temperature is also an important influence on water chemistry. Rates of chemical reactions generally increase with increasing temperature. Temperature is a regulator of the solubility of gases and minerals (solids) – or how much of these materials can be dissolved in water. The solubility of important gases, such as oxygen and carbon dioxide increases as temperature decreases. For example, warm water contains less dissolved oxygen (DO) than cold water. Inversely the solubility of most minerals increases with increasing temperature.
Thermal Stratification
Thermal stratification refers to the layering that occurs, particularly in the warm months, during which a warmer, less dense layer (the epilimnion) overlies a colder denser layer (the hypolimnion). Thermal stratification is a common occurrence in deep northern temperate lakes such as Onondaga Lake. Between these two layers is a third layer (the metalimnion) where strong vertical differences (gradients) in temperature, and therefore, density prevail. The vertical temperature profile shown below depicts this layering for a hypothetical summer profile.
Note that the set-up of this graph may seem somewhat atypical when compared to formats used in other scientific disciplines – the surface is at the top of the Y-axis (Depth axis), with increasing depths moving down this axis. This convention is commonly used by lake scientists (limnologists) for all vertical profile data, as its configuration is consistent with the character of the vertical measurements of the profile.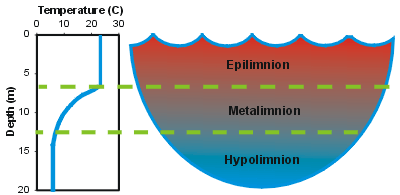
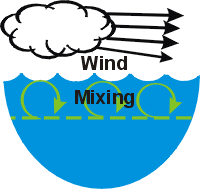 Thermal stratification is widely considered to be an important regulator of the overall metabolism of a lake. The epilimnion is usually relatively well mixed, as it is subject to mixing induced from the wind. In contrast, mixing is much more limited in the hypolimnion because these deeper lake layers are isolated from energy inputs imparted to the lake’s surface. Exchange of dissolved substances between the epilimnion and hypolimnion (across the metalimnion) is quite limited because of the low level of turbulence/mixing. Generally the greater the temperature/density gradient of the metalimnion, the less exchange across this layer. This limited mixing has important implications for the cycling of critical constituents such as nutrients and dissolved oxygen.
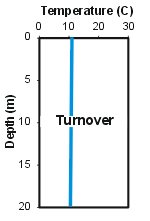
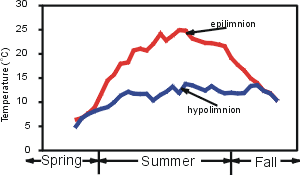
Lakes in this climate experience major seasonal changes in the thermal stratification regime that are coupled to the seasonality of meteorological conditions. In early spring, after the loss of ice-cover, vertically uniform low temperatures are observed top to bottom. The absence of vertical temperature gradients allows mixing to occur throughout the water column with only modest energy (wind) input. This interval of uniform temperatures is referred to as spring turnover. Thermal stratification develops when surface waters are heated more rapidly (from increasing air temperature and solar radiation) than the heat mixingcan be distributed by vertical mixing. Progressive increases in the temperature of the epilimnion occur during summer, accompanied by increases in the temperature/density gradient in the metalimnion. Cooling of the epilimnion starts in late summer or early fall as air temperatures and solar radiation inputs decrease. The dimensions of the epilimnion deepen progressively until vertically isothermal conditions develop – the onset of fall turnover.
 The features of thermal stratification of a particular system, such as the timing of turnover and the onset of stratification, the vertical dimensions of the layers, and the temperature of the layers, are manifestations of a number of system-specific characteristics and the influence of various environmental (forcing) conditions. In particular, these features are regulated by basin morphometry (size, shape, depth), and setting, attendant meteorological conditions, hydrology, and the extent of light penetration. Substantial year-to-year variations in the features of stratification can occur as result of natural variations in meteorological conditions.
Tributary Temperature Cycle
Tributaries (e.g., creeks and rivers) tend to be more dynamic in their temperature variation then are deeper lakes. Just as air temperature varies throughout the day, typically shallower water body’s temperature varies with diurnal solar cycle. Like air temperature, the water temperature typically is at coolest just before sunrise and at it warmest in late afternoon. Variation in cloud cover and air temperature will also effect the temperature of tributaries. Additionally, the sounding topography (hills) and vegetation (tree canopy) effect tributary temperature. Like other aquatic system in our region, tributaries experience a seasonal temperature cycle, with cool temperature in the winter and warmer in the summer. Typically tributaries warm faster in the spring and cool faster in the fall than lakes. This has consequence on a tributaries behavior upon enter a lake (e.g., density currents)
What to look for in our systems?
Seasonal heating and cooling will be clearly manifested for all robotic deployments. Additionally, Onondaga Creek will experience diurnal variation in temperature. The overall seasonal stratification regime described above will be observed in all the lakes that are part of the Network.
- Specific Conductivity
What is it?
Electrical conductivity is a measure of a material’s ability to conduct electricity. The electrical conductivity of water is the a measure of the water’s ionic activity and content. The higher the concentration of ionic (dissolved) constituents, the higher the conductivity. Conductivity of the same water changes substantially as its temperature changes. This can have a confounding effect on attempts to compare this feature across different waters, or seasonal changes in this parameter for a particular body of water. The use of specific conductance [SC; units of microSiemens per centimeter (µS/cm) or milliSiemens per centimeter (mS/cm)], the conductivity normalized to temperature of 25 °C, eliminates this complication and allows valuable comparisons to be made.
How is it measured?
By definition, specific conductivity is the reciprocal of the specific resistance of a solution measured between two electrodes 1 cm2 in area and 1 cm apart. Conductivity is thus measured by placing two electrodes (with opposite electrical charge) in the water. For a known electrical current, the voltage drop across the electrodes reveals the water’s resistance. Since the resistance of aqueous solution changes with temperature (resistance drops with increasing temperature), the resistance is corrected to the resistance of the solution at 25 °C
Why is it important?
SC is generally found to be a good measure of the concentration of total dissolved solids (TDS) and salinity. Elements whose ionic forms contribute the most to these measures include: calcium (Ca2+), magnesium (Mg2+), sodium (Na+), potassium (K+), bicarbonate (HCO3-), sulfate (SO42-), and chloride (Cl-). Values of SC can differ greatly from system to system because the composition of inflowing tributaries reflects the geology of their watersheds. For example, the SC values of the Eastern Finger Lakes of New York, that are located in limestone-rich watersheds, are much higher than observed in the Catskill lakes and reservoirs of New York, where gneiss dominates. There are of course anthropogenic (human impact on nature) sources of these materials such as road salt, non-point source pollution (for example, agricultural run-off) and industrial inputs.
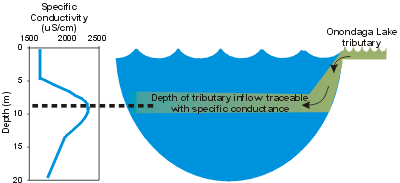
SC serves as a valuable tracer of water movement in aquatic systems. This is based on the nearly conservative (unreactive) behavior of the ionic constituents, and therefore SC, in most water bodies. Limnologists and environmental engineers often take advantage of this in conducting material budgets and in testing mathematical models (represents the behavior of a constituent according to equations) for lakes and reservoir. As a tracer, SC can also show the presence of density currents (see details) in a lake or reservoir.
What to look for in our systems?
Commonly, SC trends often track runoff conditions. Decreased runoff, commonly observed in summer, provides decreased dilution for ionic inputs in tributaries, usually manifested as increases in SC. Major runoff events may impart abrupt decreases in SC in Onondaga Creek and subsequently in the lake.
- Dissolved Oxygen
What is it?
The concentration of dissolved oxygen [DO, units of milligram per liter (mg/L)] is perhaps the single most important feature of water quality. It is an important regulator of chemical processes and biological activity. Most forms of aquatic life require oxygen (DO). For example, certain combinations of low temperature and high DO concentrations are required for the maintenance of a cold water sport fishery (such as trout and salmon). Plant photosynthesis produces oxygen within the region below the water surface with adequate light (photic zone). Microbial (for example, bacteria) respiratory and organic decay processes consume oxygen. Near the reservoir surface, oxygen can move between the water and air. The rate and direction of this exchange is dependent on the wind speed and status of the surface waters with respect to the equilibrium or saturation concentration.
How is it measured?
Dissolved oxygen is measured using a DO probe. The DO probe consists of small silver anodes and a gold cathode. These electrodes are separated from the surrounding lake water by a Teflon membrane. Dissolved oxygen diffuses across the membrane and is reduced to OH- ions at the cathode and AgCl is formed at the anode. The current associated with this process is proportional to the DO in the surrounding water
Why is it important?
Saturation Conditions
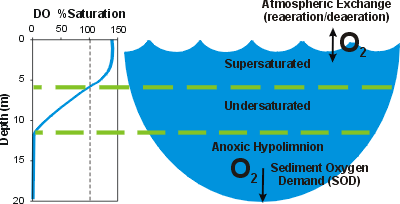
Oxygen is moderately soluble in water. The solubility limit, or saturation concentration of DO is largely regulated by temperature. Concentrations that exceed the saturation value are described as supersaturated. Such conditions reflect high photosynthetic activity (i.e. during an algal bloom). Undersaturated conditions prevail when the DO concentration is less than the saturation value, indicating oxygen-demanding processes exceed the sources of DO.
Depletion in the Bottom Waters
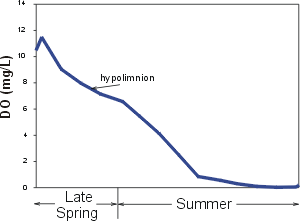
Upon the onset of thermal stratification the hypolimnion (see thermal stratification) becomes isolated from sources of oxygen. DO is widely observed to decrease progressively in the hypolimnion over the period of stratification, because the demand for oxygen associated with respiration and decay exceeds the sources. This is illustrated by the time plot of DO concentration in the hypolimnion
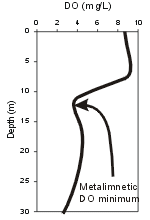
 Oxygen demand in the hypolimnion is usually localized at the interface between the lake bottom (sediments) and the overlying water column. This bottom demand is described as sediment oxygen demand (SOD). DO DOexampleconcentrations are widely observed to decrease progressively with depth in the hypolimnia of mesotrophic and eutrophic lakes as the sediments are approached, because of the localized demand at the bottom and the limited vertical mixing at these depths. DO concentrations in metalimnia and hypolimnia of oligatrophic (low productivity) lakes are often higher than in the overlying epilimnia. These differences are temperature based, as satuation DO values are higher than in the overlying epilimnia. These differences are temperatue based, as saturation DO values are higher at lower temperatures of the metalimnia and hypolimnia. DO minima and/or maxima may at times be observed in the metalimnia of certain lakes and reservoirs generally associated with high localized concentrations of plankton (see plot of metalimnetic DO minimum in profile to right)
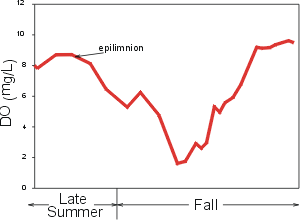
Oxygen concentrations are replenished in the lower layers during fall turnover. Reductions in oxygen concentrations may be observed in the upper waters of a lake during this interval if very low DO levels developed in the hypolimnion, reflecting the outcome of mixing of high (for example, saturated) and low (from the oxygen-depleted hypolimnion) DO concentrations. A particularly sever case of such dynamics for DO in an eplimnion is illustrated by the time plot on the right.
What to look for in our systems?
Progressive depletion of DO from the hypolimnion of eutrophic/mesotrophic Onondaga Lake occur annually. Anoxia (zero DO) occurs first at the bottom and expands upward through late June to early July, until the entire layer is anoxic. Modest lake-wide DO depletion may be evident during fall turnover.
- pH
What is it?
pH is defined as:
pH = - log10 [H+]
where [H+] = concentration of H+
The pH scale ranges from 0 to 14, that denotes various degrees of acidity or alkalinity. A value of 7 is neutral; values below 7 and approaching 0 indicate increasingly acid conditions (higher H+ concentrations), while values above 7 approaching 14 indicate increasing alkalinity. Since these are logarithmic values, each integer represents a H+ concentration ten times greater than the next higher number. The average of pH values is not a meaningful statistic because of the above logarithmic relationship. Rather, a pH value corresponding to the average H+ concentration should be calculated (from antilogarithms of pH).
How is it measured?
The measurement of pH (hydrogen ion concentration) employs an electrode consisting of a proton selective glass reservoir filled with a pH 7 reference solution. Protons (H+ ions) interact with the glass, setting up a voltage potential across the glass. Since the H+ concentration of the reference solution does change, the difference between the voltage potentials are proportional to the observed pH.
The pH electrode (as part of the YSI 6600 sonde), is calibrated prior to each deployment. A two-point procedure utilizing reference (buffer) solutions with known pHs is used.Why is it important?
A wide range of pH values is encountered in different lakes and reservoirs associated primarily with the different ionic chemistries of the respective watersheds/tributaries. Inorganic carbon constituents the major pH buffering system in most fresh waters. pH is an important regulator of chemical reactions and an important influence on aquatic biota (including composition). The temporal and vertical patterns of pH in lakes and reservoirs are mediated through the dynamics of photosynthetic consumption and respiratory/decomposition production of carbon dioxide (CO2). Photosynthetic uptake of CO2 tends to increase pH (e.g., during phytoplankton blooms) while decomposition/respiration tends to decrease pH.
What to look for in our systems?
Central New York lakes, the Seneca River and Onondaga Creek are generally considered to be alkaline, hardwater lakes, where pH is well-buffered against major changes. Values of pH between 7 and 8.5 usually prevail. Higher values within this range generally occur in the upper productive layers where photosynthetic rates are the highest. Lower values prevail in the hypolimnion of more productive lakes due to respiration and decay of organic matter that has settled out of the productive overlaying epilimnion layer.
- Turbidity
What is it?
The word “turbidity” [Tn, units of NTU’s] has been used in a general sense to indicate the extent to which water lacks clarity. Turbidity is tightly linked to the optical aesthetics of water, and therefore the public’s perception of water quality. The public prefers water of high clarity for recreation and
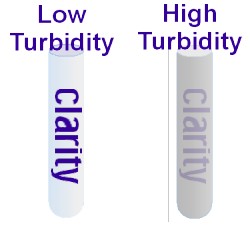 consumption.
Water supplies are generally regulated for turbidity levels (values < 1 NTU normally prevail; e.g., usually after treatment).
Turbidity has been criticized as an imperfect scientific measure, but it is widely used and applied as a measure of quality for water supplies. Further, it has been demonstrated to have utility in the estimate of Secchi disc transparency (another widely used measure of clarity), the concentration of total suspended solids (TSS), and the light scattering coefficient (an important optical characteristic). A number of scientists have recommended Beam Attenuation Coefficient (BAC) as better measure of “turbidity” than turbidity.
How is it measured?
Turbidity, until the recent development of probes such as these adopted at this site, was measured in the laboratory with a nephelometric turbidimeter. The unit of measure is nephelometric turbidity units (NTU). In nephelometers, a beam of light is directed along the axis of a cylindrical glass cell containing the sample. Light scattered by particles from the beam within a rather broad angle centered on 90 º is measured by a detector located on one side of the cell. The turbidity probe on the buoy is constructed in a similar manner as the nephelometer, except that the scattered light detector is located within the water as opposed to outside a glass sample cell. The accuracy of field probes, at the low turbidity levels of interest to water supplies, can not presently match laboratory instrumentation.
Why is it important?
Turbidity in water bodies is caused by a heterogeneous (mixed) population of suspended particles, which may include clay, silt, finely divided organic matter (detritus), phytoplankton (microscopic free floating plants), and other microscopic organisms. In general, this population of particles in a lake is a composite of sediments received in tributary inflows, resuspended lake sediments, and particles produced within the lake (particularly phytoplankton). Thus, the variations in measured turbidity may reflect the dynamics of phytoplankton growth as well as tributary runoff (driven by the timing of rainfall events).
What to look for in our systems?
High turbidity observations are expected to occur only irregularly, for short intervals in these lakes, associated primarily with meteorological events. Particularly high runoff events can result in large inputs of sediment and increases in turbidity. During runoff events, turbidity is often seen as an interflow, that is a peak in turbidity will be seen near the thermocline.
- Chlorophyll
What is it?
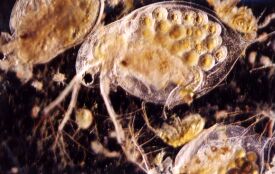
Chlorophylls are complex molecules found in all photosynthetic plants, including phytoplankton (microscopic plants dispersed in the waters).
 Chlorophyll, contained within the plant's cells, allows the plant to utilize sunlight as part of the their metabolism. There are several types of chlorophyll
  identified by slight differences in their molecular structure and constituents. These include chlorophyll a, b, c, and d. Chlorophyll a is the principal photosynthetic pigment and is common to all phytoplankton. Chlorophyll a can therefore be used as a measure of phytoplankton biomass.

How is it measured?
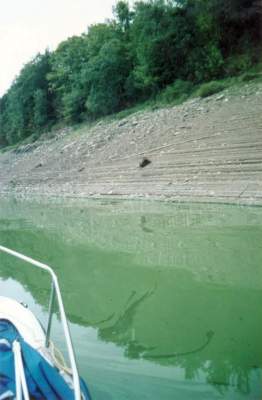 There are a number of different laboratory methods for the measurement of chlorophyll a, that differ according to extraction solvent used on concentrated (filtered) samples and analytical/instrumentation technique (e.g., spectrophotometer, fluorometer, high-pressure liquid chromatography). Advances in fluorescence technology have lead to the capability of semi-quantitative measurement of chlorophyll in water, without extraction or chemical treatment, thereby allowing in situ (in-lake) measurements as presented here for Cannonsville Reservoir. The in situ fluorometer measures of chlorophyll presented here have great utility, particularly within the context of this near-real-time data delivery program, to identify major features of temporal and vertical patterns of phytoplankton biomass in the reservoir. However, these in situ measurements are widely considered to be only rough approximations of chlorophyll a concentrations. The utility of these in situ measurements can be enhanced through adjustments to match the less frequent measurements of chlorophyll made through the field season by laboratory (extraction) methods
Why is it important?
The distribution and concentration of phytoplankton is of major water quality and ecologic concern. Managers are particularly concerned with the occurrences of excess concentrations of phytoplankton and associated nuisance conditions in surface waters, that occur in response to anthropogenic inputs of critical plant nutrients (particularly phosphorus). The concentration of phytoplankton is widely used as an indicator of the level of production of these microscopic plants (e.g., primary production or trophic state). Phytoplankton biomass is the primary regulator of clarity and color of water in many lakes and reservoirs.
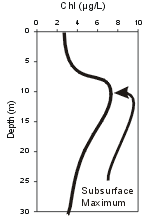 The most widely used measure of phytoplankton biomass is chlorophyll a. It has several advantages as a measure of phytoplankton biomass, including: (1) the measurement is relatively simple and direct, (2) it integrates cell types and ages, (2) it accounts to some extent for cell viability, and (4) it can be quantitatively coupled to important optical characteristics of water. However, the concentration of chlorophyll a is an imperfect measure of phytoplankton biomass, as the cellular content of this pigment depends on the composition of the phytoplankton community and ambient environmental conditions.
What to look for in our systems?
Concentrations of chlorophyll are usually much higher in the epilimnia of lakes and reservoirs compared to hypolimn
 ia, because the available light limits phytoplankton production to the upper layers. The vertical pattern within the epilimnion tends to track that observed for temperature. The lower levels of the hypolimnion reflect depositing phytoplankton.
 - Meterological Parameters
Overview
Meteorological conditions (the weather) directly impact the physical and biological condition of lakes and tributaries. Some of the most immediate changes are seen in tributaries which often respond rapidly to changes in precipitation, temperature and solar insolation. Changes in wind speed and direction can frequently be seen in the shape of a lake’s temperature profile. Monitoring these data is important in quantifying changes within lakes or tributaries.
Air Temperature
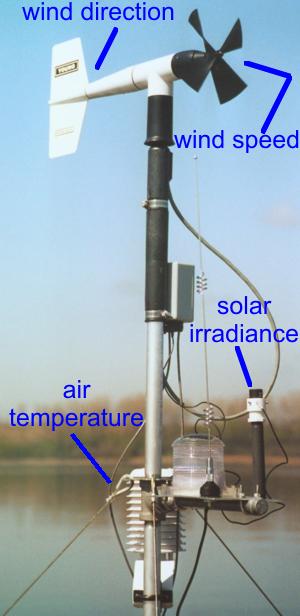
Air Temperature is measured using a method similar to the measure of water temperature. The air temperature probe is enclosed in a radiation shield (to protect the probe from direct sunlight) and is mounted on a mast above the buoy.
Air temperature contributes to thermal stratification of a lake. It also influences the temperature of tributaries.
Wind Speed and Direction
Wind Speed is measured in units of m/s (meter per second) and wind direction is measured in degrees from north using an anemometer. The anemometer consists of propeller attached to a weather vane which keep to propeller pointing into the wind and also allows for the measurement of wind direction. The anemometer is position at the top of a two meter pole located on top of the buoy. The wind moving past the propeller causes the propeller to rotated. The number of rotation per unit time of the propeller is calibrated to wind speed. The position of the weather vane to the north pointing bearing establishes the wind direction.
Wind velocity (wind speed and direction) determines a lake’s thermal structure. Typically higher wind speeds create larger waves and increase turbulence in the upper waters of a lake. This can lead to the deepening of the thermocline or during time of weak stratification can lead to turnover. Wind driven waves can increase shoreline resuspension of sediments which can effect turbidity levels, increase the available nutrients, and possible introduce toxic sediments into the water column. Below the lake surface, higher wind speeds can induce a tilting of the thermocline with subsequent internal wave generation that can lead to bottom resuspension. If thermocline tilt is large, an upwelling could occur resulting in metalimnetic and hypolimnetic waters reaching the surface layer. An upwelling event occurred in Onondaga Lake on September 11, 2002. Strong sustained winds blowing out of the northwest along the major axis of the lake produced an upwelling event that was responsible for a large fish kill in the northwest section of the lake. The upwelling of anoxic, reduce species rich hypolimnetic water reduced the oxygen concentration to near zero throughout the water column in the north end of lake.
Relative Humidity
Measured in units of percent saturation. The probe utilizes a material that changes its dielectric properties which enhances its capacitance as it absorbs moisture.
Humidity can be expressed as relative (to saturation of water in air) which is a temperature dependent measurement similar to expressing dissolved oxygen as percent saturation. Thus changing the temperature will change the relative humidity since warmer air can hold more water vapor. Humidity can also be expressed as a dew point temperature, which is the temperature at which saturation or condensation will occur. Specific humidity, expressed as grams of water vapor per kilogram of moist air, is a measure of the actual amount of water vapor or moisture in the air, regardless of the air's temperature.
Relative humidity is an import factor in evaporation. Evaporative cooling from a surface of a lake or stream is one of the mechanisms which effects its heat budget
Solar Irradiance
Solar irradiance is measured in units of w/m2 (watts per square meter) using a pyrometer. The pyrometer is mounted on meteorological station pole. The sensor uses a photodiode that creates an electrical current that is calibrated to the amount of radiation falling upon the sensor.
Quantifying solar irradiance is important in establishing heat budgets and well as in photosynthesis.
Upstate Freshwater Institute (UFI) is a not-for-profit [501 (C) (3)] research corporation (established in 1981) dedicated to the improvement of water quality and the advancement of freshwater research. We are a NELAC/NELAP accredited laboratory (NY Laboratory ID No. 11462, EPA Laboratory Code NY01276) since 1994.

224 Midler Park Dr
Syracuse, NY 13206
Fax: 315-431-4969
Phone: 315-431-4962
UFI does not discriminate on the basis of race, color, national origin, sex, age, disability or religion in our workplace, our programs, or our community activities.


