- Overview
Overview
The data that are collected from the robots are often interesting because they tell various stories as to events that occur within the monitored systems. For example, a plot showing the maximum winds over the last 24 hours may be interesting simply because we may have observed particularly high winds and the robot’s meteorological station has quantified just how ‘windy’ it had been. Likewise, observing dissolved oxygen depletion from the lower waters of Onondaga or Otisco Lake during the summer months may be of interest. There are numerous additional uses for these data. In this section we will examine analyzes that have been automated to depict important features of these systems, that can be updated on routine basis.
Thermocline Depth
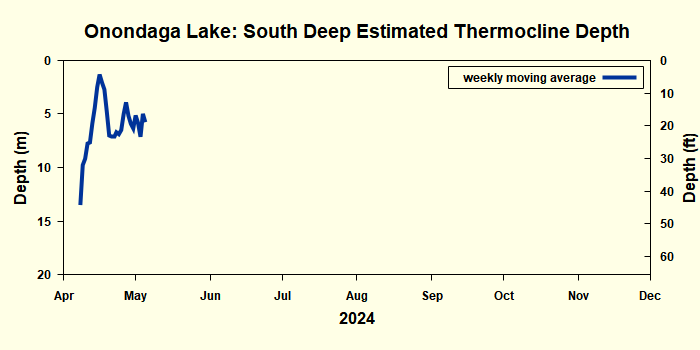
The thermocline depth is defined by the depth in the water column where the temperature changes most rapidly. We have automated the identification of the maximum thermal gradient for each profile and are routinely updating the time-series plots representing the thermocline depth, See Thermocline Depth
Transparency Estimates
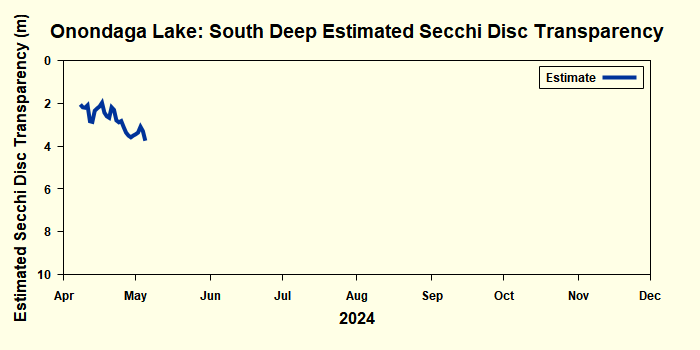
Water column transparency is important for scientific, public health and public perception reasons. Traditionally transparency has been measured with a Secchi disc which requires manual measurements. It is possible to create a surrogate measure of Secchi disc transparency using turbidity. Here we are applying this relationship to estimate transparency from data collected remotely. See Transparency Estimates.
Density
The density of water and particularly its variation with changes in temperature and salinity greatly influence the dynamics of lakes and streams. The difference in density throughout the water column establishes the stratification that is experienced in many of our local lakes. Typically, temperature has the strongest influence on density. However Onondaga Lake and the Seneca River reach below Onondaga Lake is also noticeably influenced by salinity. We set the background on how temperature and salinity effect density here.
Density Stratification
Typically density differences in the water column increase from spring into summer and decrease in the fall due to temperature changes in the water column. For plots updated routinely to show the water column density throughout the deployment season, see Density Stratification.
Density Currents
Density currents occur when an inflow enters a lake with a density greater than the surface waters and local mixing conditions are inadequate to prevent plunging. These inputs are often manifested as mid-depth discontinuities in such parameters as turbidity and specific conductivity. See Density Currents.
- Thermocline Depth
Overview
The thermocline depth is defined by the depth in the water column where the temperature changes most rapidly. The depth of the thermocline has important consequences on the biology and chemistry of a lake.
Thermal Stratification
Thermal stratification refers to the layering that occurs, particularly in the warm months, during which a warmer, less dense layer (the epilimnion) overlies a colder denser layer (the hypolimnion). Thermal stratification is a common occurrence in deep northern temperate lakes such as Onondaga Lake. Between these two layers is a third layer (the metalimnion) where strong vertical differences (gradients) in temperature, and therefore, density prevail. The vertical temperature profile shown below depicts this layering for a hypothetical summer profile.
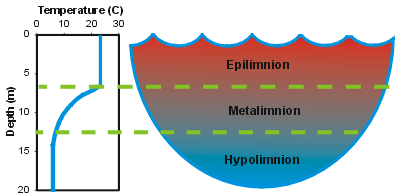
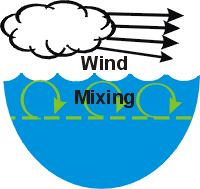
Thermal stratification is widely considered to be an important regulator of the overall metabolism of a lake. The epilimnion is usually relatively well mixed, as it is subject to mixing induced from the wind. In contrast, mixing is much more limited in the hypolimnion because these deeper lake layers are i
 solated from energy inputs imparted to the lake’s surface. Exchange of dissolved substances between the epilimnion and hypolimnion (across the metalimnion) is quite limited because of the low level of turbulence/mixing. Generally the greater the temperature/density gradient of the metalimnion, the less exchange across this layer. This limited mixing has important implications for the cycling of critical constituents such as nutrients and dissolved oxygen.
The thermocline depth is defined by the depth in the water column where the temperature changes most rapidly
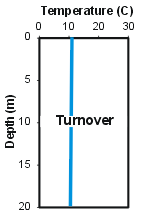
 Lakes in this climate experience major seasonal changes in the thermal stratification regime that are coupled to the seasonality of meteorological conditions. In early spring, after the loss of ice-cover, vertically uniform low temperatures are observed top to bottom. The absence of vertical temperature gradients allows mixing to occur throughout the water column with only modest energy (wind) input. This interval of uniform temperatures is referred to as spring turnover. Thermal stratification develops when surface waters are heated more rapidly (from increasing air temperature and solar radiation) than the heat mixingcan be distributed by vertical mixing. Progressive increases in the temperature of the epilimnion occur during summer, accompanied by increases in the temperature/density gradient in the metalimnion. Cooling of the epilimnion starts in late summer or early fall as air temperatures and solar radiation inputs decrease. The dimensions of
 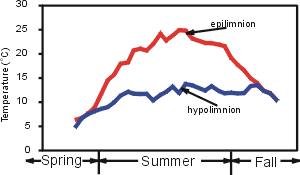 the epilimnion deepen progressively until vertically isothermal conditions develop – the onset of fall turnover.
The features of thermal stratification of a particular system, such as the timing of turnover and the onset of stratification, the vertical dimensions of the layers, and the temperature of the layers, are manifestations of a number of system-specific characteristics and the influence of various environmental (forcing) conditions. In particular, these features are regulated by basin morphometry (size, shape, depth), and setting, attendant meteorological conditions, hydrology, and the extent of light penetration. Substantial year-to-year variations in the features of stratification can occur as result of natural variations in meteorological conditions.
- Transparency Estimate
Overview
Water column transparency is an important feature of water quality and has ecological implications. Traditionally transparency has been measured with a Secchi disc. A Secchi disc is a small black and white disk that is lowered below the water surface until it is just visible. This depth is referred to as the Secchi disc depth. Secchi disc measurements are made manually. However, it is often possible to create a surrogate measure of Secchi disc transparency using turbidity. Here we apply this approach to estimate transparency from data collect remotely.
Background
Turbidity (Tn, NTU), as measured with a nephelometer or turbidimeter, measures light scattered by particles from a beam within a rather wide angle centered on 90º. Turbidity is a surrogate metric of the spectral average scattering coefficient (b, m-1), an inherent optical property of water that quantifies the intensity of the light scattering process. Various authors have reported Tn to be approximately equal to b. As a surrogate of b, Tn has been found in some cases to be a reasonably good predictor of common limnological optical measures of water quality, such as the diffuse spectral average light attenuation coefficient for downwelling irradiance (kd) and Secchi disc transparency (SD).
Estimation of Secchi Disc from Robotic Turbidity Measurements
Secchi disc transparency is highly sensitive to changes in b. Accordingly, some success in estimating changes in SD for individual systems, and differences in this metric in cross-section studies, from Tn measurements has been previously demonstrated. The relationship between SD and Tn has been described by
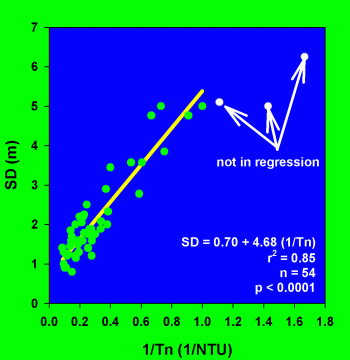
Figure 1. Regression of Secchi disc versus the inverse of robot turbidity measurements. From Onondaga Lake South Deep robot over the years of 2000, 2001 and 2002
SD = N”/Tn
However, the coefficient N" can differ widely between systems and with time in an individual system, as it depends on the ratio of scattering to absorption, the relationship between Tn and b, and conditions that influence the SD measurement.
The relationship between SD and the robotic Tn measurements for the upper waters of Onondaga Lake was evaluated from approximately paired (within two hours) observations in 2000, 2001, and 2002, years that included the substantially higher SD observations during the clear water phase. This population is far from normally distributed, but it does include a number of clear water phase (e.g., SD>3 m) observations. The best fit linear least squares regression expression for the SD versus Tn (for 1/Tn < 0.9) relationship was strong (r2 = 0.85) and highly significant (p < 0.0001), though the intercept deviated from zero.
The scatter around the best fit line reflects variations in N”, as well as inaccuracies in the SD and Tn measurements. The scatter for conditions outside of clear water phase intervals compromises the utility of Tn measurements to track SD dynamics when values less than 3 m prevail. Thus the robotic Tn measurements do not represent an adequate basis to establish future compliance with New York's swimming safety SD standard of 1.2 m. The primary utility of robotic Tn measurements as an estimator of SD is to aid resolution of the dynamics of water clarity experienced as part of the clear water phase, when relatively large changes in SD occur. This is illustrated for the May-June intervals of 2001and 2002 ((See Figure 2). The predictions of SD tracked the observations well, with the exception of the false high prediction for June 10, 2001. The daily robotic measurements of Tn support finer temporal resolution of SD dynamics than the weekly measurements of the long-term monitoring program. For example, from figure 2 we see that SD apparently decreased rapidly following the observation on June 18, 2001.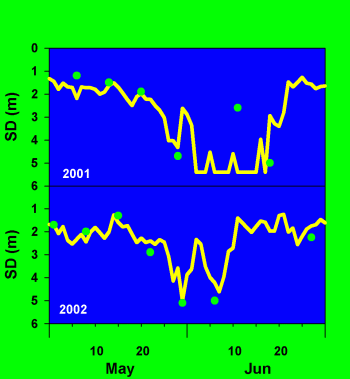
Figure 2. Secchi disc prediction utilizing regression from Figure 1 for the years 2001 and 2002.
Two SD maxima, separated by a decrease, are indicated over the late May to early June interval of 2002, a temporal pattern that has been documented by more frequent SD measurements in an earlier year (1999). SD is predicted to have decreased rapidly after the peak of early June of that year.
- Density
Water Density
Water density (mass per unit volume; kg/m3) plays an important role in lake dynamics. The density of water is largely influenced by temperature and salinity. Pure water is at its densest (1000 kg/m3) at 4 °C (39 °F). Water expands (becomes less dense) as the water temperature is increased or decreased from 4 °C (See Figure 1). Increasing amounts of dissolved substances (increasing salinity, which is represented here as Specific Conductivity) causes the water to become denser (See figure 2).
rhoT
Figure 1. Water density as a function of temperature
Water in the form of ice at 0 °C (32 °F) is at its minimum density (917 kg/m3). In contrast, liquid water at 0 °C has a density of 999.8 kg/m3. This density difference allows ice to float upon the water in which it forms. Similarly, water of lower density will float upon water of higher density. For example water at 25 °C will float upon water at a lower temperature. Salinity’s effect on density is important in some of our systems (primarily Onondaga Lake, Onondaga Creek and Seneca River downstream of the Onondaga Lake outlet). From Figure 2, the effect of salinity on density is quite profound were water at 15 °C and specific conductivity of 2200 µS/cm has same density as pure water at 4 °C (its maximum density). - Density Stratification
Differences in density throughout the water column establish the stratification that is observed in our local lakes. Typically, temperature has the strongest influence on density stratification. Generally density differences in the water column increase from spring into summer with the upper warmer water being less dense then the cooler lower water. The heating of upper water is largely the result of increased solar radiation and from heat inputs from the warmer air. Density differences tend to decrease in the fall. Generally solar heating tends to increase stratification (greater density differences) while winds blowing across a lakes surface tends to remove the stratification. In deep lakes, during the summer months differences in density throughout the water column tend to be large enough to resist wind mixing, however during the fall (or early spring) reduced density stratification allows wind to more easily mix the water the column. When the stratification is significantly weak, turnover occurs. The plots shown on the following pages illustrate the features of current stratification.
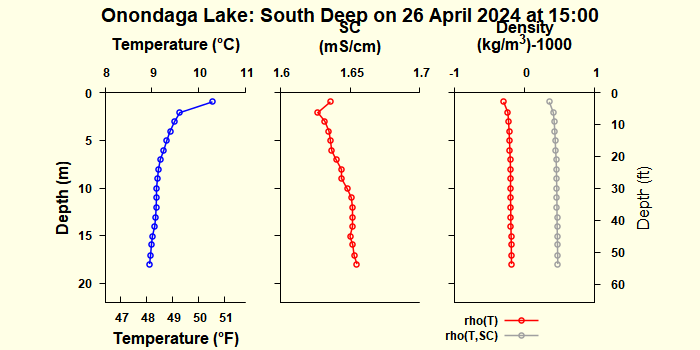
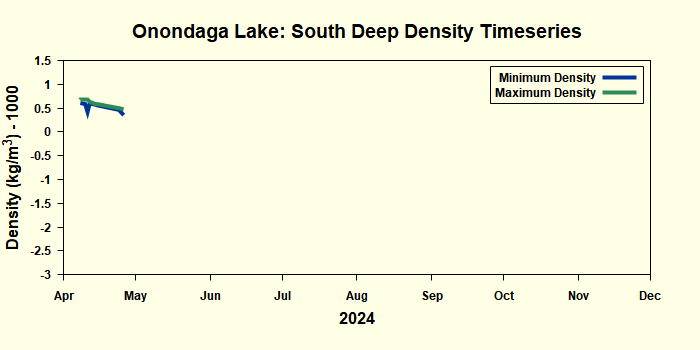
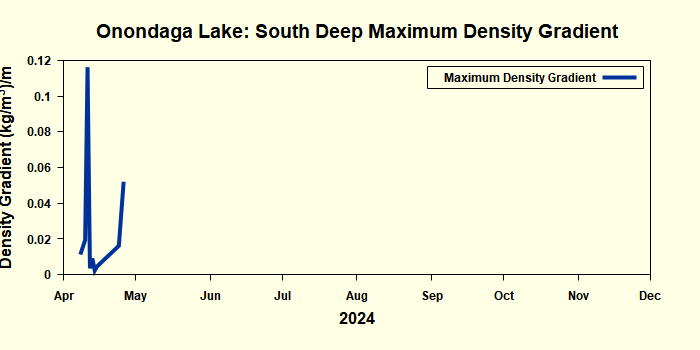
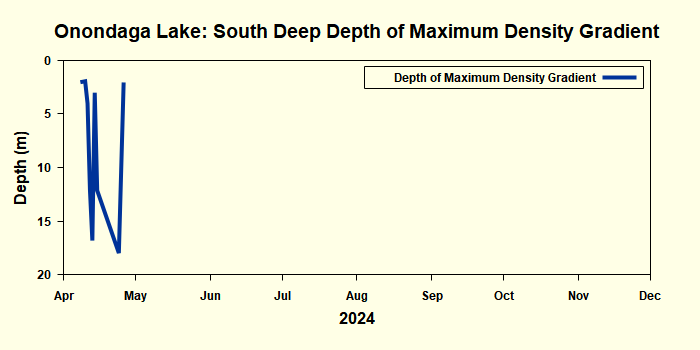
In the plots that follow, the depth and magnitude of maximum density gradient are identified. This depth is often characterized as the thermocline depth. A time-series plot showing the minimum and maximum densities during each profile is presented. Finally, the most recent profile's temperature (T), specific conductivity (SC), and density (calculated with and without salinity effects) are presented.
- Density Currents
Density differences often prevail between tributaries and receiving lakes and reservoirs. These inflows tend to plunge when their density is greater than the surface layer of the receiving system, entering as a density current (where temperature or salinity are responsible) or turbidity current (where the suspended solids concentration dominates). If the density of the inflow is less then the surface layer, the inflow will tend to travel along the surface, thus entering as an overflow (See Figure 1). If local mixing is inadequate in the region of the inflow to eliminate density differences, the density or turbidity current will plunge and travel along the sloping bottom as an underflow. These processes are accompanied by entrainment of ambient water. If a depth is encountered in a stratified system where the density of the underflow equals that of the water column, the neutrally buoyant density current separates from the bottom and intrudes into that layer as an interflow.
A number of investigators have reported in the literature the occurrence of density currents. Plunging inflows were documented for Wellington Reservoir, Australia associated with salinity pollution. Most often the phenomenon is attributable to seasonal temperature differences; e.g., tributaries are often cooler than surface waters of receiving lakes and reservoirs in late summer and fall in north temperate climates. The plunging inflow phenomenon can be a concern for public health and water quality issues associated with contaminates and pollutants that may be carried in density currents. These usually are transient events, such as the chemical spill in Sacramento River (1991) that subsequently entered Shasta Reservoir, CA as a density current and the more common occurrence of turbid density currents in water supply lakes and reservoirs following runoff events. In Onondaga Lake, the plunging of its major tributaries may limit the availability of nutrient inputs for aquatic plant growth.Figure 1. Animation of density currents (overlows, underflows and interflows)
Onondaga Lake
Onondaga Lake and its major natural tributaries have elevated salinity levels. During times of low flow in tributaries, the salinity can be several times the salinity of lake water. This salinity difference can cause the contribute to these tributaries. We frequently see the affect of plunging in the profiles measured by the robot at South Deep. Often we can anticipate the plunging depth to which Onondaga Creek will plunge by comparing its density to the water column's density.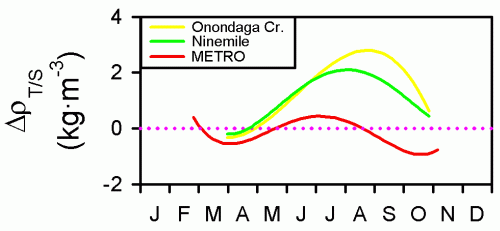
Figure 2. Density long-term density seasonal density difference (inflow density minus lake surface density)
Since inflows are major sources of nutrients to the lake, the location where they enter may affect how these nutrients influence aquatic life. Presently Onondaga Lake has an abundance of nutrients, so limiting external loading of nutrients to the lake is a priority in its cleanup. Since algae grow near the lake's surface, nutrients entering the water column near the surface will have a greater impact on their growth. The plot above (Figure 2) illustrates how differences in temperature and salinity affect Onondaga Lake's major inflows. We see that the outfall of Metro, tends to enter as an overflow or to plunge slightly. On the other hand, the tributaries tend to plunge for most of the year. This indicates that the Metro nutrient load would be relatively more available for algae growth then the tributary sources.
We can identify the effects of density currents from the robot profile data. For example, Figure 3 shows turbidity profile data for two different years (2002 and 2004) measured with the South Deep robot. Each plot contains two curves representing conditions prior to the density current event. The green line represent the antecedent conditions while the yellow illustrates the response of the system to the interflow event. Plots (a)-(c) illustrate interflow events with mid-profile peaks in turbidity. Plot (d) illustrates an overflow event where the inflow temperature was warmer than the lake surface temperature (which is frequent occurrence in spring). The final plot (e) illustrates a condition were the lake was not stratified and tributary density was similar to that of lake water.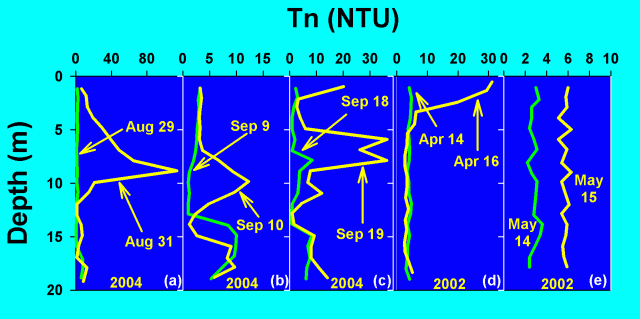
Figure 3. Turbidity signatures of density currents (green line - before event; yellow line - after event )
In Figure 4, we present an example illustrating an interflow occurrence during a runoff event in late July 2004. The top three time-series plots (a)-(c) are the Onondaga Creek conditions during the runoff event. The top plot (a) is the creek flow (Q) at Dorwin Avenue as measured by the USGS. Plots (b) and (c) are measured turbidity (Tn) and temperature (T) at the former automated monitor site at Dorwin Avenue (with lake surface temperatures added for comparison). In these plots we see that the turbidity increases in response to the increased flow.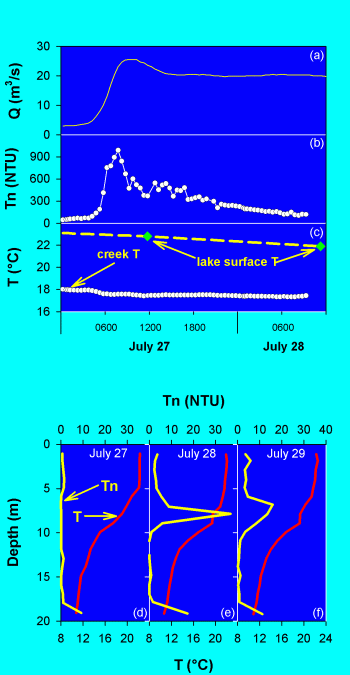
Figure 4. Storm event in July 2004. The time-series plots show flow (a), creek turbidity, and creek temperature relative to the lake’s surface temperature (c). The profiles (d)-(f) show the measured turbidity and temperature at South Deep during the event and illustrate the occurance of an interflow at about 8 m.
Profile plots (d)-(f) in Figure 4 illustrates the effect of the runoff event on the turbidity profile, clearly demonstrating the existence of an interflow (e) with a turbidity maximum of over 30 NTU at 8 m. Plot (d) shows the antecedent condition prior to the event while plot (f) shows the post event profile, depicting a reduction in impact (e.g., settling and mixing). Underflow events are often seen in the dissolved oxygen (DO) profiles near fall turnover. Onondaga Lake’s hypolimion remains anoxic from early summer until fall turnover in mid to late October. However, apparently anomalous DO profiles with nonzero DO occasionally occur in the bottom-most measurement, see Figure 5. This is characteristic of an underflow transporting oxygenated tributary (and perhaps entrained oxygenated surface) water to the bottom waters. Tributary temperatures are more responsive to changes in meteorological conditions than lake water. In the spring the lake is slowly warming from winter temperatures while tributary temperatures may be several degrees warmer responding to warmer air temperatures and greater solar heating. Thus in the spring, warmer tributary water will tend to overflow colder lake surface waters. Conversely, in the fall, tributaries will tend to cool more rapidly than lake waters in response to cooler air temperatures and reduced solar heating. Thus during the fall, tributaries tend to enter as an underflow.
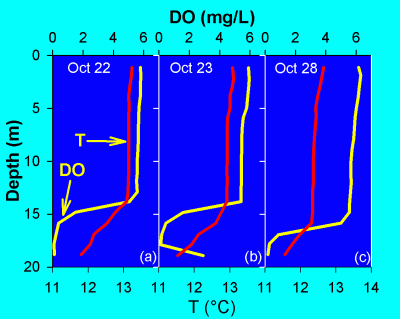
Figure 5. Example of underflow occurrence prior to fall turnover. Plot (b) shows increased dissolved oxygen (DO) in the near bottom characteristic of underflowing oxygenated inflow. The underflow continued until October 28 (c).
Upstate Freshwater Institute (UFI) is a not-for-profit [501 (C) (3)] research corporation (established in 1981) dedicated to the improvement of water quality and the advancement of freshwater research. We are a NELAC/NELAP accredited laboratory (NY Laboratory ID No. 11462, EPA Laboratory Code NY01276) since 1994.

224 Midler Park Dr
Syracuse, NY 13206
Fax: 315-431-4969
Phone: 315-431-4962
UFI does not discriminate on the basis of race, color, national origin, sex, age, disability or religion in our workplace, our programs, or our community activities.


